Written against the build you can download today.
Tutorial
Klarion end to end, for somebody who already reverse engineers and has not used this one. It assumes you know what a cross-reference is; what it does not assume is where Klarion keeps them, what it refuses to guess, or which of its habits will catch you out on the first afternoon.
Everything below was run before it was written. The output blocks are what the tool printed, against a stock 64-bit notepad.exe copied to target.exe — a real signed binary with no symbols, which is roughly the situation you are usually in and which you already have a copy of.
Getting it running
Download the installer from the download page and run it. It is not yet code-signed, so SmartScreen will warn; the checksum is published beside the download, and verifying it before you run it is the correct habit for a tool that takes untrusted binaries as input.
$ certutil -hashfile klarion-1.1.0-windows-x64-setup.exe SHA256You get three things: klarion.exe, the application; klarion-cli.exe, the same engine without the window; and a python folder holding klarion.pyd. The application needs no licence and no account. The command line, scripting and the Python module do — that line is drawn at automation, not at analysis.
Check what this build recognises, once
klarion-cli loaders prints every format and architecture the binary was compiled to handle. It is the answer to “why will this file not open” often enough to be worth running before you need it, because what Klarion supports is a build-time fact rather than anything to do with your file.Your first binary
01Open it, and let it finish
Drop a file on the window, or Ctrl+O. A loader claims it by inspecting the bytes, never by the extension, and analysis starts on its own. The progress is in the output drawer — Ctrl+` if it is hidden.
If detection gets it wrong, or the file is a headerless firmware image, Ctrl+Shift+O opens it as a loader you pick, and that is where you supply a base address for a raw image.
02Read what it found before you read any code
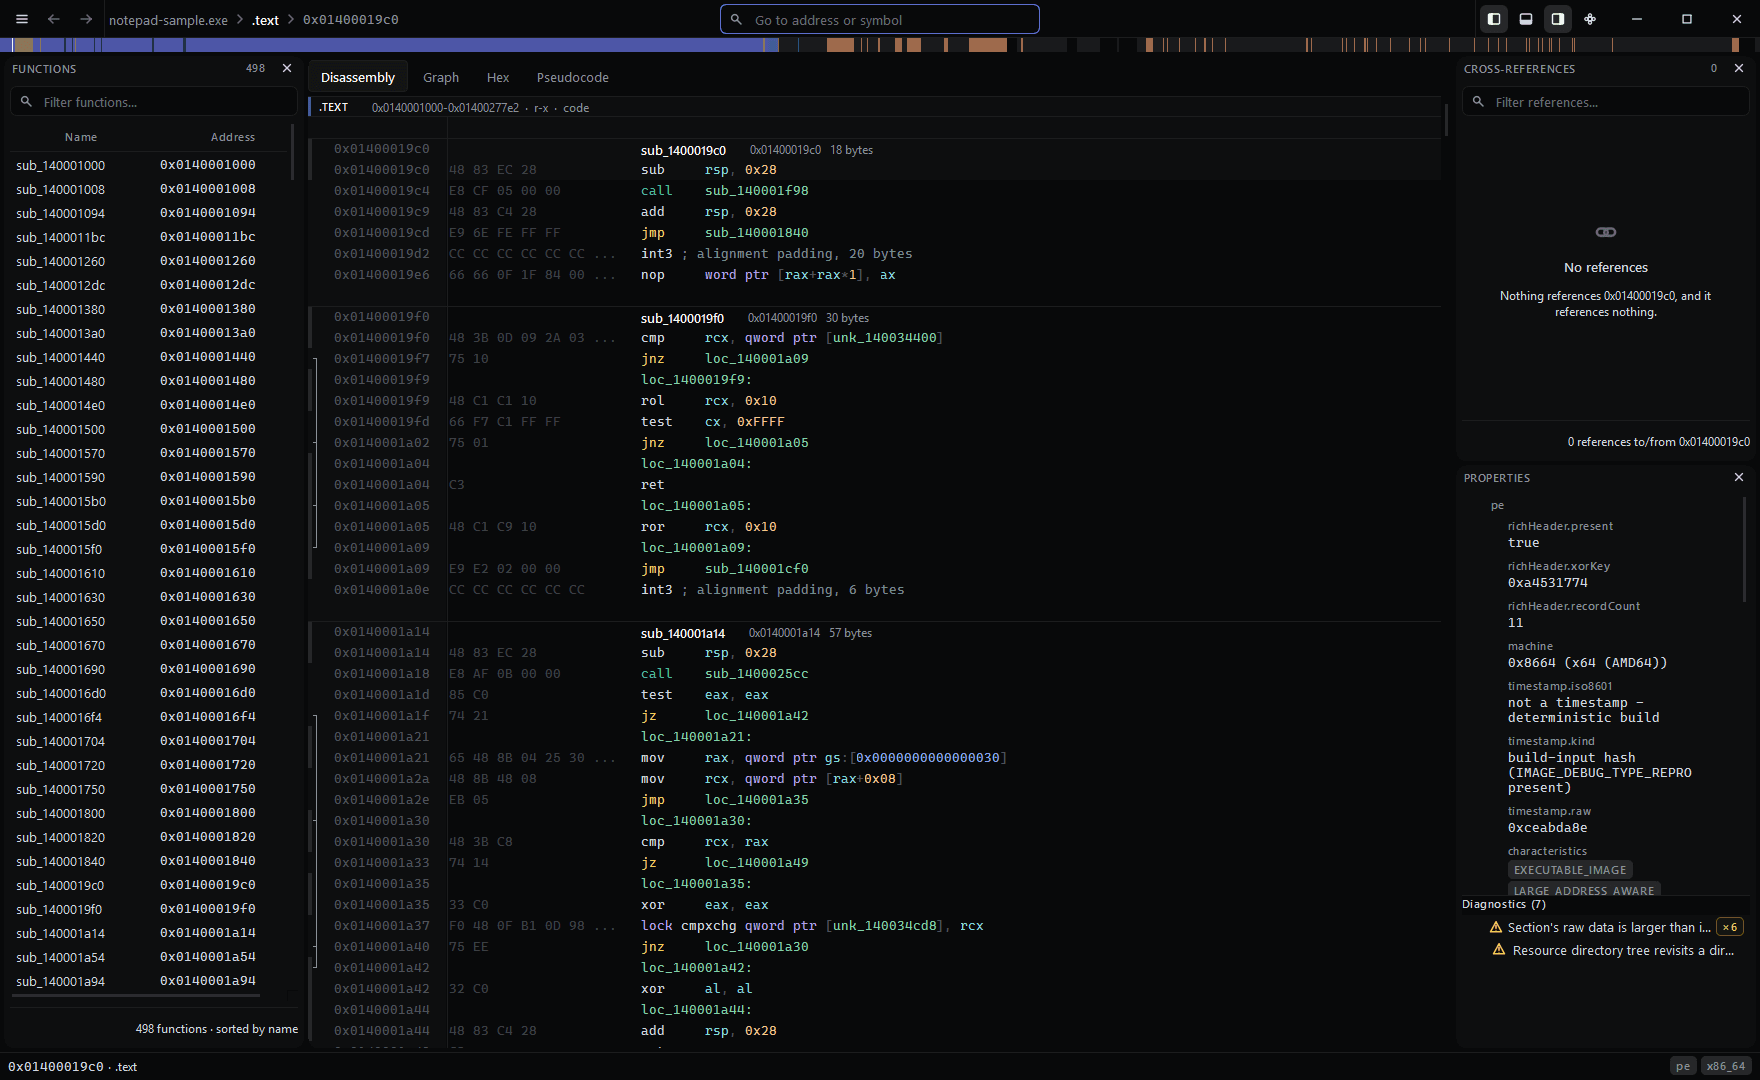
The properties panel is the fastest orientation in the tool. The same facts from the command line:
$ klarion-cli info target.exepath target.exeformat pe (PE32+ executable (Windows GUI) x64 (AMD64))architecture x86_64bitness 64-bitendianness littleimage base 0x0000000140000000address range 0x0000000140001000 - 0x000000014005935cfile size 352.0 KiB (360448 bytes) entry points (1): 0x00000001400019c0 image-entry entry sections 8segments 8symbols 340relocations 366imported modules 56overlay noneThen the memory map, which tells you where code can even be:
$ klarion-cli sections target.exename start end size perm type file-offset.text 0x0000000140001000 0x00000001400277e2 0x267e2 r-x code 0x1000fothk 0x0000000140028000 0x0000000140029000 0x1000 r-x code 0x28000.rdata 0x0000000140029000 0x00000001400336c8 0xa6c8 r-- read-only data 0x29000.data 0x0000000140034000 0x0000000140036740 0x2740 rw- data 0x34000.pdata 0x0000000140037000 0x0000000140038218 0x1218 r-- exception data 0x35000.didat 0x0000000140039000 0x00000001400390f8 0xf8 rw- data 0x37000.rsrc 0x000000014003a000 0x00000001400581d0 0x1e1d0 r-- resources 0x38000.reloc 0x0000000140059000 0x000000014005935c 0x35c r-- relocation table 0x57000Two things in that table are worth pausing on. .pdata is the exception directory, and its presence is the single biggest predictor of how good the function recovery will be. And fothk is not a name any compiler emits — an unfamiliar executable section is exactly the sort of thing worth noticing in the first minute rather than the third hour.
03Ask what the analysis actually did
$ klarion-cli analyze target.exeAnalysis finished in 21 ms. Functions discovered: 498 (symbols: 0, exception data: 428, call targets: 57, prologue/gap scan: 13) Thunks detected: 40 No-return functions: 0 Jump tables recovered: 0 Unresolved indirect branches: 49 Xrefs built: 2409 Strings found: 765 C++ classes recovered: 4 (names applied: 5) Decode failures: 0Read the breakdown, not the total. 428 of those 498 functions came from the exception table, which means they are facts the binary stated rather than guesses; 13 came from the prologue and gap scan, which are the ones to be sceptical of. A binary where that ratio is reversed is one Klarion is largely guessing about, and it will tell you so rather than presenting the two kinds of answer as if they were the same kind.
Unresolved indirect branches: 49 is the count that matters most and the one most tools do not print. Those are 49 places the control flow goes somewhere Klarion could not follow — and so 49 places code may exist that nothing has reached. They are counted rather than quietly dropped, because a jump table you did not know you missed is how a function goes unanalysed and unnoticed.
Getting around
Klarion is keyboard-first; the mouse is for the graph. Two keys cover most of a session — Ctrl+P to go anywhere by name, and Escape to come back — and if you forget everything else, Ctrl+Shift+P has every command in the application with its shortcut printed beside it. Every binding below is rebindable.
Moving around
The two you will use most are at the top, and neither needs you to know an address first.
- Ctrl+P
- Go to anything: functions, symbols, strings, addresses.
- Ctrl+Shift+P
- Command palette. Every command in the application, searchable.
- G
- Go to address.
- Ctrl+E
- Go to entry point.
- X
- Show references to whatever is under the cursor.
- Escape
- Back, along the trail of everywhere you jumped from.
- Ctrl+Shift+Right
- Forward again.
Looking at it
- Space
- Toggle between the linear listing and the graph.
- Ctrl+1
- Disassembly.
- Ctrl+2
- Graph.
- Ctrl+3
- Hex, with the data inspector.
- F5
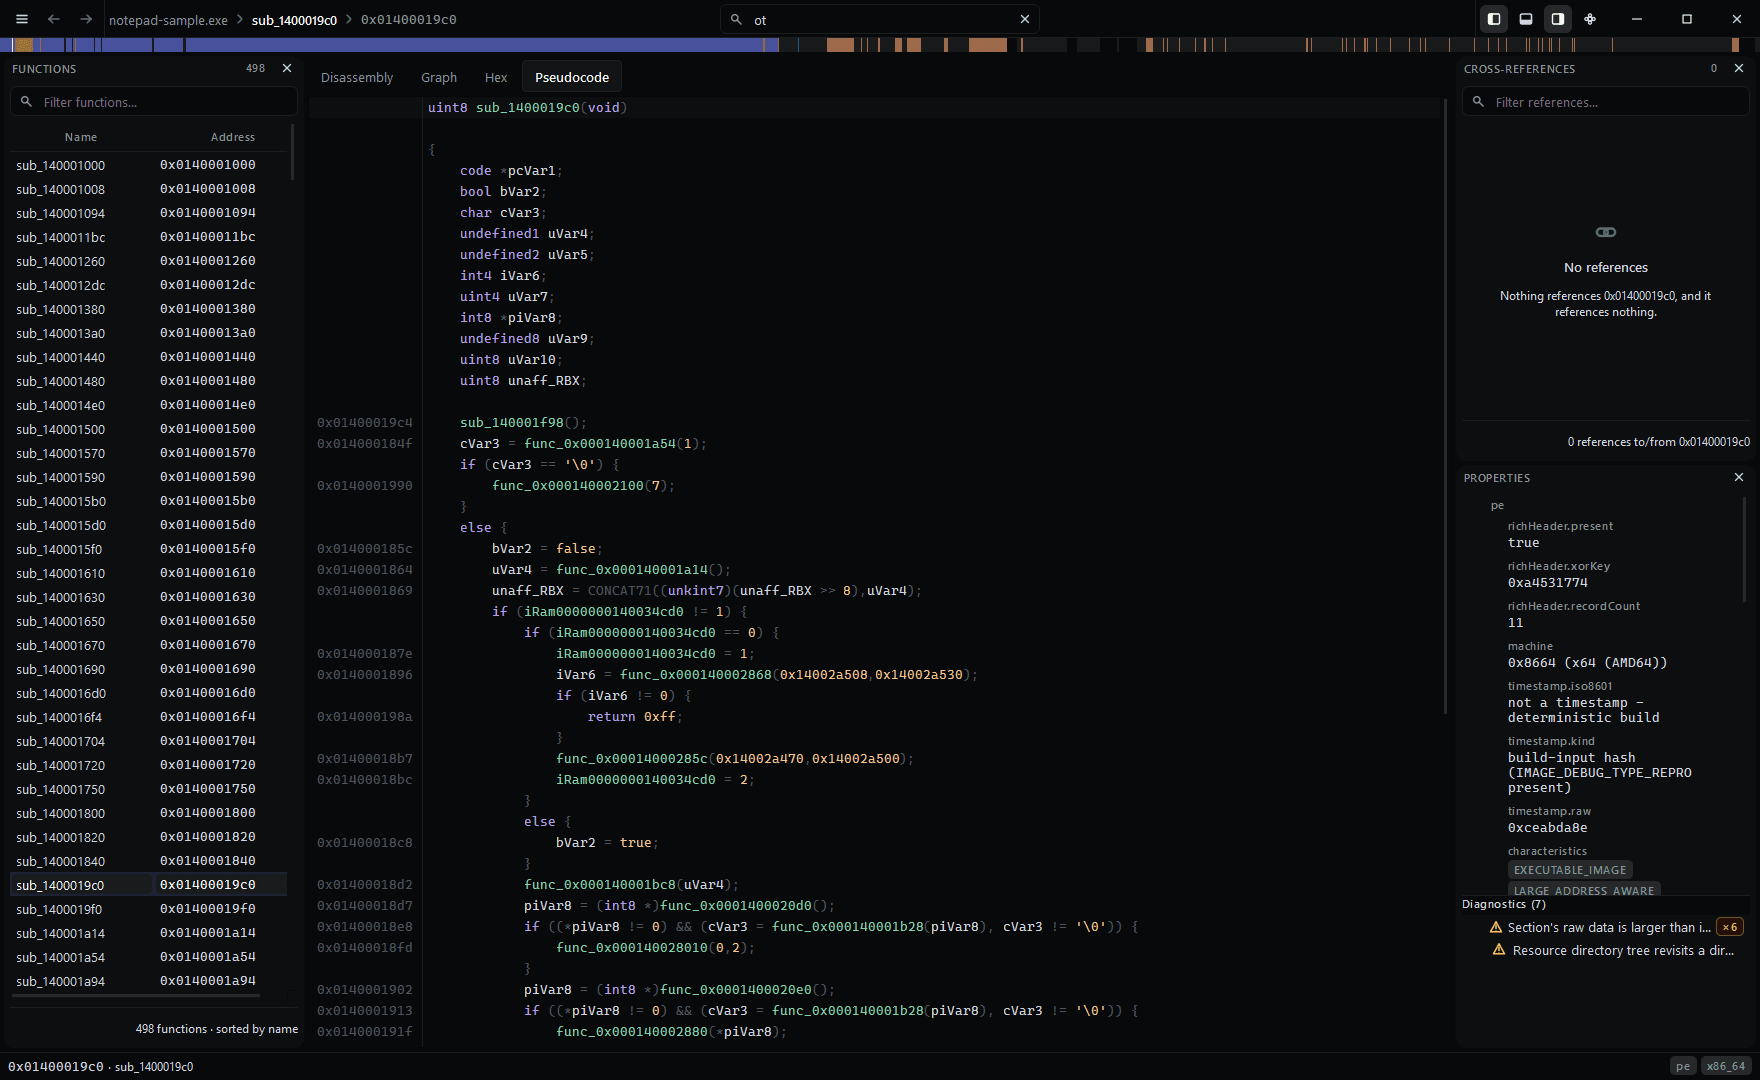
- Decompile. The IDA binding, because your hands already know it.
Changing it
Everything here is undoable, and analysis is never allowed to overwrite any of it.
- N
- Rename whatever is under the cursor.
- ;
- Add a comment.
- P
- Create a function here, when analysis did not.
- Ctrl+Alt+A
- Assemble an instruction over the one under the cursor.
- Ctrl+R
- Run the analysis pipeline again.
- Ctrl+Shift+D
- Look for obfuscated control flow in this function, and offer to rebuild it.
- Ctrl+Z
- Undo. Ctrl+Shift+Z or Ctrl+Y to redo.
Panels
Each of these opens a tab in the centre column. Ctrl and the key.
- Ctrl+F
- Search.
- Ctrl+4
- Strings.
- Ctrl+5
- Imports.
- Ctrl+6
- Exports.
- Ctrl+7
- Symbols.
- Ctrl+8
- Segments.
- Ctrl+9
- Bookmarks.
- Ctrl+0
- Entropy.
- Ctrl+T
- Types.
- Ctrl+M
- Comments.
- Ctrl+K
- Call tree.
- Ctrl+U
- Snapshots.
- Ctrl+L
- Scripts.
The frame
- Ctrl+B
- Show or hide the functions panel.
- Ctrl+Shift+I
- Show or hide the references and properties panels.
- Ctrl+`
- Show or hide the output drawer.
- Ctrl+Shift+M
- Maximise the panel you are in.
- Ctrl+Shift+O
- Open As — force a loader when detection is wrong.
Arriving from IDA
Doing the actual work
01Start from a string or an import, not from main
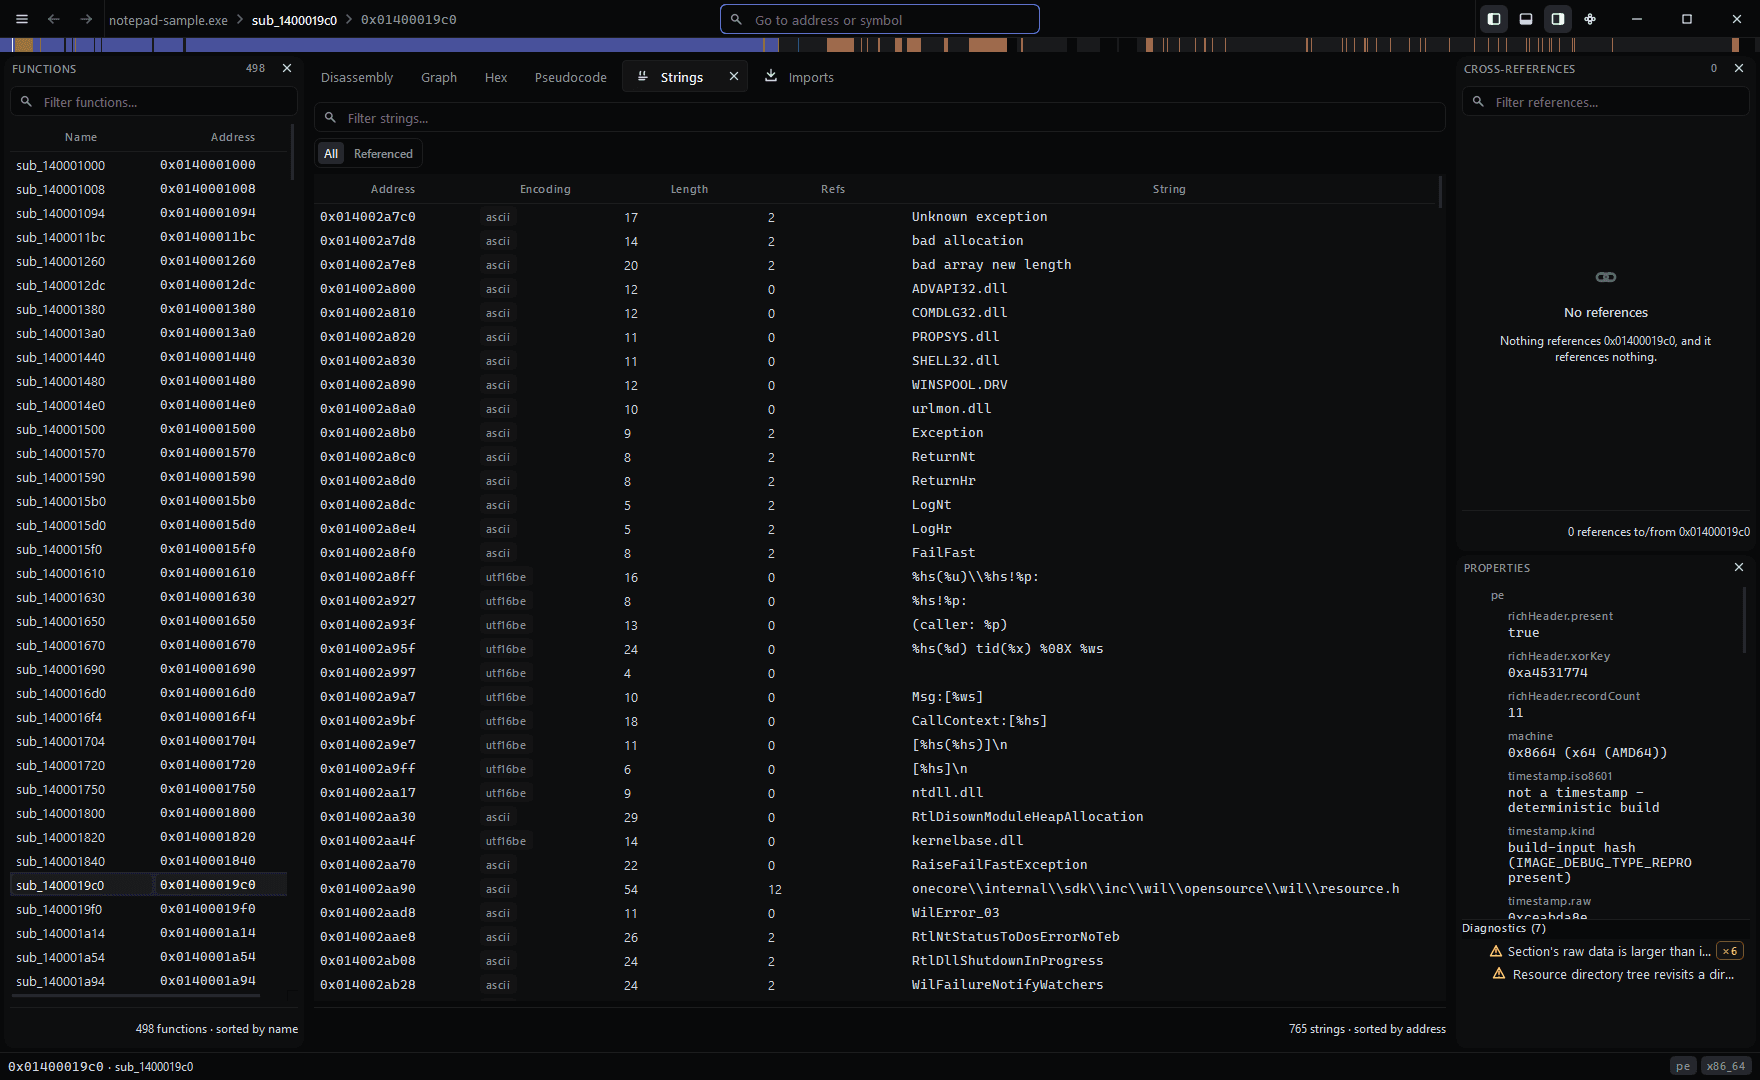
The fastest way into an unfamiliar binary is to find something it says or something it calls, and work backwards. Open strings with Ctrl+4 or imports with Ctrl+5, put the cursor on one, and press X. From the command line the same question:
$ klarion-cli xrefs target.exe CreateFileW0x0000000140029de8 CreateFileW references to (2): 0x000000014000ca5c read (in sub_14000ca10+0x4c) 0x000000014000deaa read (in sub_14000da7c+0x42e) references from (0):Note that each reference names the function it falls inside and the offset within it, so you can tell “opens a file at the top of its work” from “opens a file deep in an error path” without opening either.
02Name things as you understand them
N renames whatever is under the cursor — a function entry, a data item, a plain label. ; adds a comment. Both are keyed to an address rather than to a function, which is why renaming a global works exactly like renaming a function.
The rule underneath this is worth knowing early, because it changes how freely you can work: analysis is never permitted to overwrite something you decided. Every edit records where it came from — you, analysis, a script, an import — so re-running analysis with Ctrl+R, applying a signature database or porting names from a diff will all refine what you have not touched and leave what you have. You never have to work defensively.
03Fix what the analysis got wrong
Where Klarion did not recognise a function — and with 49 unresolved indirect branches in that binary, there will be somewhere — put the cursor on the first instruction and press P. If nothing decodable is there it declines and says so, rather than producing an empty function that looks like a result.
Going the other way: disasm will decode from any address without running the pipeline at all, which is the quickest way to check whether something is code before you commit to it.
$ klarion-cli disasm target.exe --count 40x00000001400019c0 48 83 ec 28 sub rsp, 0x280x00000001400019c4 e8 cf 05 00 00 call 0x0000000140001F980x00000001400019c9 48 83 c4 28 add rsp, 0x280x00000001400019cd e9 6e fe ff ff jmp 0x000000014000184004Give the data a shape
Ctrl+T opens the type editor: structures, unions, enumerations, typedefs and function prototypes, with correct layout for both the Windows and System V data models. Apply a type at an address and the listing, the pseudocode and the hex view all follow it at once.
On a C++ binary a lot of this is done for you. Classes recovered from RTTI become real types — four of them in the run above — so a pointer the decompiler proves is a Foo * renders member accesses by name rather than as offsets.
05Change the bytes
Ctrl+Alt+A assembles a replacement instruction over the one under the cursor, in the mnemonic you would have typed, for any of the twelve architectures. The listing re-decodes through the patch immediately, so you are reading the patched program rather than the original with a note attached.
Nothing touches the file on disk until you write one out, and what is written is read back and checked rather than assumed.
06Keep it
Ctrl+S writes a .kldb project: one file holding every name, comment, type, bookmark, patch and snapshot. Undo covers the whole session, and Ctrl+U opens snapshots — named points you can return to, which is what you want before trying an interpretation you are not sure about.
The same file is what klarion-cli --save writes and what the next script reads, so work moves between the window and the command line without an export step.
When you have symbols, or half of them
Analysis is dramatically better with debug information, and Klarion takes it from wherever it exists. Put a .pdb beside the binary, or a DWARF-carrying ELF or Mach-O, and names, real function boundaries, parameters, locals and source line numbers all come across. A PDB is matched on both its identifier and its age, so a stale one left from an earlier link is refused rather than applied to addresses it no longer describes.
Where you have no symbols, two things stand in. Signature databases identify statically linked library code and report the library, version and compiler each match came from, so you can judge a match rather than take it. And where you have another build that does have symbols, diff the two and carry the names across:
$ klarion-cli diff with-symbols.exe stripped.exe --apply-names --saveFunctions are matched on several independent signals at once — identical bytes, a normalised hash that ignores relocation and layout, mnemonic sequences, control-flow shape — and then along the call graph. Only meaningful names port, only above a confidence bar higher than the one for merely listing a match, and never over a name you set. --show-skipped tells you what did not port and why, which is usually more interesting than the list that did.
Without the window
The command line is the same engine, and every command emits JSON, so it drops into whatever you already run. The full reference covers all nineteen commands; the shape worth internalising is that stdout carries data and stderr carries everything else, so a redirect always produces a file that parses.
$ klarion-cli functions app.exe --min-size 64 --json | jq -r '.[].entry'The other split worth internalising: some commands read the file and answer, others run the whole pipeline first. info, sections, imports and strings are instant; functions, xrefs, analyze, diff and strings --referenced-only are not.
Scripting it
When a command stops being enough, the same analysis is reachable from a script. Ctrl+L opens the Scripts panel in the application, and the same file runs headless:
$ klarion-cli script target.exe survey.luaThe question every triage starts with, as a script — not which APIs are imported, but which are actually reached, and from how many places:
-- Which imported functions does this binary actually call, and-- from how many places? The first thing worth knowing about-- something you were handed with no context.local counts = {}for _, mod in ipairs(klarion.importedModules()) do for _, sym in ipairs(mod.symbols) do local n = #klarion.xrefsTo(sym.address) if n > 0 then counts[#counts + 1] = { name = sym.name, module = mod.name, uses = n } end endend table.sort(counts, function(a, b) return a.uses > b.uses end)for i = 1, math.min(#counts, 20) do local c = counts[i] print(string.format("%4d %s!%s", c.uses, c.module, c.name))end 35 api-ms-win-core-com-l1-1-0.dll!CoTaskMemFree 26 api-ms-win-core-heap-l1-1-0.dll!GetProcessHeap 23 USER32.dll!SendMessageW 15 api-ms-win-core-synch-l1-1-0.dll!AcquireSRWLockExclusive 14 api-ms-win-crt-private-l1-1-0.dll!_o__errno 13 api-ms-win-core-libraryloader-l1-2-0.dll!GetModuleHandleW 12 api-ms-win-core-winrt-string-l1-1-0.dll!WindowsCreateStringReference 11 api-ms-win-core-errorhandling-l1-1-0.dll!GetLastError 11 api-ms-win-crt-string-l1-1-0.dll!wcsnlen 10 api-ms-win-core-handle-l1-1-0.dll!CloseHandleTwelve lines that would have taken an afternoon of clicking, and the shape of the answer is the useful part: this is a program that frees COM allocations, talks to windows and manipulates strings.
Lua is sandboxed: its os and io libraries are never opened, so running a script against a binary you do not trust does not hand it your machine. Changes a script makes live in memory until --save writes the project.
From your own Python
For a notebook, a CI job or a pipeline that already exists, the relationship goes the other way: your interpreter imports Klarion. Put the installed python folder on PYTHONPATH and import klarion. It binds the same forty-three operations under the same names, with the no-argument ones spelled as properties.
# Triage a directory: which of these binaries touch the APIs# you care about, and how big is each one's real code surface?import globimport klarion WATCH = {"CreateRemoteThread", "VirtualAllocEx", "WriteProcessMemory", "WinHttpConnect", "RegSetValueExW"} for path in sorted(glob.glob("samples/*.exe")): with klarion.open(path) as program: hits = sorted({ symbol.name for module in program.imported_modules for symbol in module.symbols if symbol.name in WATCH }) stats = program.statistics print(f"{path:40} {stats.functionCount:6} functions {', '.join(hits) or '-'}")It is a CPython 3.13 extension for 64-bit Windows, and unlike Lua it confines nothing — it is a library in a process you already control, and klarion.isolation() says so. The scripting reference documents both languages together.
Which one to reach for
Letting an agent drive
The MCP server exposes twenty-two tools over JSON-RPC on stdio, so a model can drive the engine the way you drive the window: open a binary, list functions, disassemble, decompile, chase cross-references, read RTTI, rename and comment. Three of those write to the analysis and each says so in capitals before it is called; none of them touches the binary on disk. Scripting is not registered at all unless the server was started with --allow-scripting.
Where to go next
The honest summary of what Klarion will and will not do for you: it recovers a great deal, it tells you which parts are evidence and which are inference, and it counts what it could not work out instead of hiding it. The three counts to keep an eye on are unresolved indirect branches, decode failures, and how many functions came from the gap scan rather than from the exception table.
Stuck on something this page did not cover?
The gaps in documentation are the ones the author could not see, which makes a question about one genuinely useful. It usually turns into a paragraph here.